


Reading Your Results
Learning to read it will not turn you into a clinician, and it is not meant to replace the conversation about your results. What it does is more modest and genuinely useful: it lets you follow along, ask sharper questions, and see why a particular hearing aid or plan might fit your pattern of loss.
None of it requires memorizing the numbers. Once you know what the two axes stand for and where your own marks fall, the rest tends to click into place. If you would rather have someone walk you through your own results in person, our team does exactly that at every visit.
At a glance
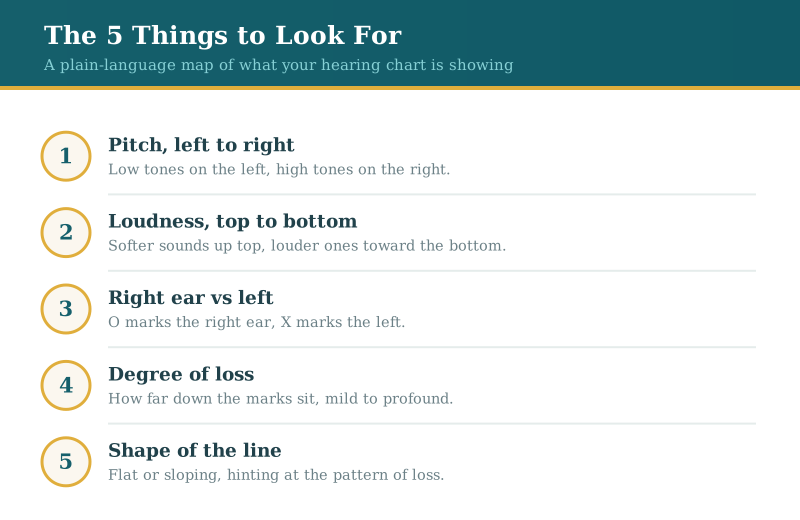
- An audiogram plots pitch left to right and loudness top to bottom; your marks show the softest sounds you can hear.
- Right and left ears are graphed separately, usually as O for right and X for left.
- How far down the marks sit tells the degree of loss, and the shape of the line guides treatment.
Pitch runs left to right
The horizontal axis is pitch, measured in hertz, running from low tones on the far left to high tones on the far right — think of moving from the left end of a piano to the right. Speech lives across this whole span, but consonants that give words their crispness sit toward the higher pitches. Wherever your marks dip on that side of the chart is where clarity tends to suffer first.
Loudness runs top to bottom
The vertical axis is loudness, measured in decibels, with the softest sounds near the top and the loudest toward the bottom. Each mark answers one question: how quiet a sound at that pitch can be before you just barely hear it. The higher a mark sits, the fainter a sound you can catch. The lower it drops, the louder that pitch has to be before it reaches you.
Right ear and left ear, side by side
Your two ears are graphed separately, and comparing them is one of the more revealing parts of the page. By convention the right ear is plotted with an O and the left with an X, often in red and blue. When the two sets of marks track closely, your ears are performing about the same. When they diverge — one ear clearly lower than the other — that gap matters, both for how you localize sound and for how any fitting is set up. A lopsided result is also something an audiologist wants to look at more closely rather than assume.
How far down your marks sit
Once you know your marks are low, the next question is how low. Audiologists sort results into bands — normal, mild, moderate, moderately severe, severe, and profound — set by how far down the chart your softest detectable sounds fall. Two people can both land in the 'moderate' band and still hear the world differently, which is why the category is a starting point rather than the whole story. For older adults weighing what comes next, our guide to hearing aids for seniors picks up where the chart leaves off.
The shape of your hearing line
The last thing to notice is the overall shape your marks trace. A line that stays fairly level across the chart points to loss that is similar at every pitch. A line that starts high on the left and slides down toward the right — the most common pattern with age and noise exposure — means the high pitches have faded while the low ones hold steadier. A line that holds steady, dives at 4,000 Hz, and then climbs partway back at 8,000 is the notch noise exposure leaves. That shape guides a hearing aid fitting, since the aim is to lift the frequencies you have lost without over-amplifying the ones you have not. It is also why two people with the same degree of loss can end up with very different settings.
Frequently asked questions
Questions patients ask us
What counts as a normal result on an audiogram?
Most charts treat the top band — roughly the softest sounds a young, healthy ear detects — as the normal range. If your marks sit in that upper zone across the pitches, your hearing tests within normal limits. Results that drift lower point to some degree of loss, and the further down they fall, the more sound you are missing.
Why is my hearing worse for high pitches?
High-frequency loss is the pattern we see most often, especially with age and a history of loud noise. The inner-ear cells that handle high pitches tend to wear first, so consonants like s, f, and th blur before vowels do. That is why speech can seem present but muddy — you can tell someone is talking without catching every word.
Can I read my own audiogram without an audiologist?
You can learn plenty from the position and shape of your own marks, and following along is worth doing. Reading the chart is not the same as interpreting it, though. Two similar-looking audiograms can call for different plans depending on your speech scores, your daily listening demands, and your goals — which is where a professional's read earns its keep.
How often should I get a new audiogram?
For stable hearing, many adults do fine with a check every couple of years, while anyone noticing a change should come in sooner. If you wear hearing aids or spend time around loud sound, a yearly test makes sense. You can schedule an evaluation at our San Mateo or San Carlos offices whenever something seems off.